
Research synthesis is also known as evidence synthesis or evidence review and comes in many different shapes and forms. Below, we will explain the types of research synthesis we performed within the projects showcased on this website.
What is research synthesis and what is it for?
The number of scientific studies in any field has literally exploded over the past few decades. It is easy to get lost in the volume of scientific evidence. To make it easier to find your way around the existing knowledge, research synthesis was developed. Depending on the type of synthesis, it summarizes, aggregates and, in some cases, even reanalyses the collected evidence.
The narrative (evidence) review
- Not used in any of our PFAS projects
The most basic type of research synthesis is the narrative review, a traditional form of review most people are familiar with. The authors start with a research question: e.g., ‘what are the health consequences of PFAS exposure?’ Subsequently, they search the scientific literature for relevant publications. Eventually, they sum up gained knowledge creating a new scientific publication. However, such an approach is open for introducing researcher’s opinions and biases. Inconvenient or contradictory evidence can be omitted and evidence that fits the reviewer’’s story best can be “cherry picked”. To make the evidence review process more rigorous, over the past few decades, research synthesis has become significantly more systematic and transparent. As result, a “systematic review family” appeared, with different members serving different purposes - examples are systematic evidence mapping and systematic review mapping, as used in our projects.
The systematic (evidence) map
- Used in the following of our PFAS projects: Burdens in wildlife
Creating a systematic evidence map means building a database of scientific documents on a specific topic. The database is supposed to give researchers, policy makers and the interested public an overview of the existing evidence and potential gaps that should be addressed by future research. The adjective ‘systematic’ stands for the nature of the process in creating the map that doesn’t leave anything to chance but uses a predetermined framework. The term map indicates that the systematic map is supposed to serve as a guide directing further research and policy making in a certain field, as it puts the available scientific documents at the readers’ fingertips.
Like in the narrative review, the authors always start with at least one research question, e.g., ‘what is the existing evidence on PFAS exposure in wildlife?’ The next step is to search for, and compile published scientific studies, theses or reports that investigated PFAS burdens in wildlife. By selecting the appropriate scientific databases and search terms (Table 1), the authors make sure that they include as much relevant literature as possible to convey a comprehensive picture of the research field. A decision tree created before the start of the literature search guides the decision if a scientific document fulfills the eligibility criteria of the evidence map (Figure 1).
Table 1: An example of a databases and search string used in the making of the systematic evidence map on the project Burdens in wildlife
| Source | Link | Search string |
|---|---|---|
| Scopus | https://www.scopus.com/ | TITLE-ABS-KEY ( (fluoroalkyl OR perfluorin* OR perfluo* OR pfas OR PFBA OR PFPeA OR PFHxA OR PFHpA OR PFOA OR PFNA OR PFDA OR PFDeA OR PFDcA OR PFUnDA OR PFUnA OR PFUA OR PFUdA OR PFDoA OR PFDoDA OR PFTrDA OR PFTriDA OR PFTrA OR PFTA OR PFTeDA OR PFO4DA OR PFO5DoDA OR PFBS OR PFBuS OR PFPeS OR PFHxS OR PFHpS OR PFOS OR PFNS OR PFDS OR FTS OR FTSA OR PFECHS OR FOSA OR PFOSA OR NEtFOSAA OR “Et-PFOSA-AcOH” OR NMeFOSAA OR “Me-PFOSA-AcOH” OR ADONA OR “Cl-PFAES” OR “F-53B” OR GenX OR “HFPO-TA” OR “Hydro-Eve” OR “Nafion BP2” OR pops) AND concentr* AND (wild* OR fish* OR bird OR mammal* OR amphibi* OR reptil* OR cetacean* OR vertebrate OR predator* OR prey* OR insect* OR crustacean* OR arthropod* OR annelid* OR worm OR coral* OR pisc* OR frog* OR mollusc* OR fly* OR larva* OR nematode* OR cnidaria OR anthozoa) AND NOT (laboratory OR rats OR zebrafish OR human* OR mouse OR mice OR diabetes OR microbial OR vitro)) |
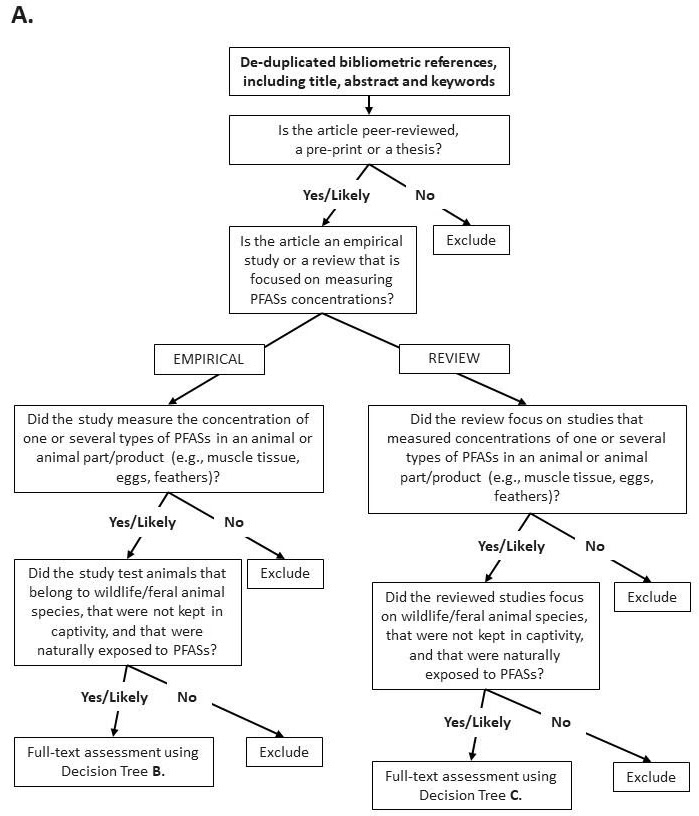
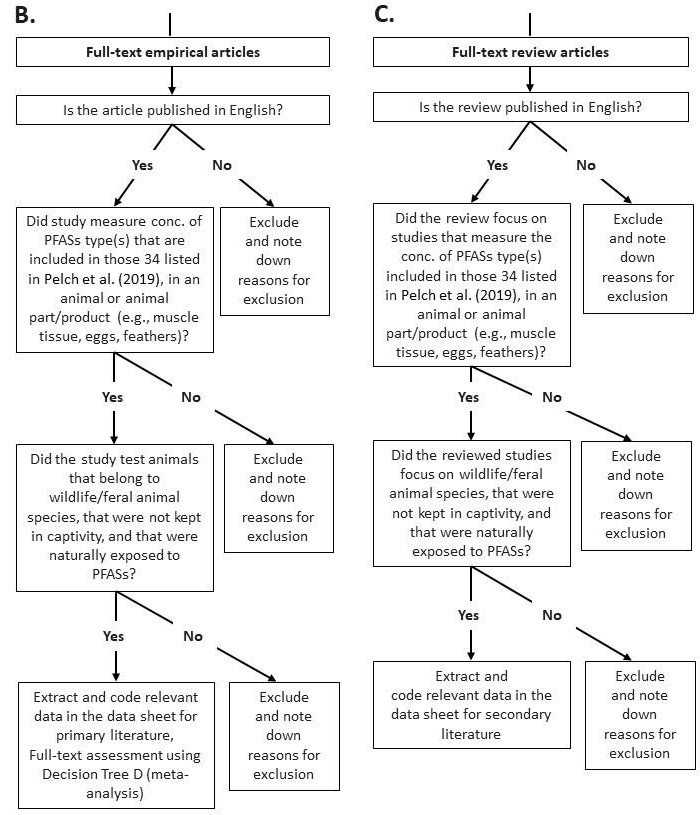
Figure 1: An example decision tree to determine eligibility criteria of scientific documents for the evidence map.
Eventually, the authors extract certain predetermined information from the selected scientific documents that best characterize the content of the studies regarding the research question(s) (Table 2). Ideally, the systematic map also includes some type of quality and reproducibility check on the included studies. This is important to get an idea of how reliable the findings of the study might be. For our project Burdens in wildlife, we decided to document if the studies included information about the source of their funding and if the authors provided their raw data and the analysis code. The industry as a source of funding might prompt questions about the external influences on the research findings. Not providing raw data and the analysis code makes it difficult to reproduce the results of a study. This information can be used to gouge if the study is reliable and robust.
| Information to be extracted | Options of answers |
|---|---|
| Study ID | Text |
| Title of paper? | Text |
| Year of publication? | Year |
| Country of research institution of first author? | Text |
| Did the authors have a conflict of interest? | Yes/No/Not stated |
| Does the study include a statement of funding? | Yes/No |
| Does the publication provide a link to the raw data? | Yes/No |
| Does the publication provide a link to the analysis code? | Yes/No |
| Did the study investigate one or multiple species? | One/Multiple |
| Were temporal trends investigated? | Yes/No |
| Did the study include measurements of PFAS only (vs. other pollutants)? | Yes/No |
| Year of sample collection started? | Year |
| Habitat of wildlife species? | Marine, Freshwater, Terrestrial inland, Terrestrial coastal, Mixed |
| Sex of specimens tested? | Male, Female, Mixed, Unknown |
Table 2: Excerpt from a predetermined data extraction form used in the making of the systematic evidence map in the project Burdens in wildlife
Once the data is extracted, the authors create a summary of their findings (e.g., describing gaps in the literature). Such summary usually includes a narrative part and a visualization of results (diagrams and colour-coded maps, tables etc.). Eventually, the evidence map is converted into a scientific publication. Ideally, the evidence map is also presented as a website with interactive features that allows the reader to browse through the extracted information from the included studies. A systematic evidence map can also include a bibliometric analysis (see below) as we did for our PFAS project Burdens in wildlife.
The systematic review map/ umbrella review
- Used in the following of our PFAS projects: Umbrella review
A systematic review map or umbrella review is very similar to a systematic evidence map. The main difference is that the umbrella review only includes reviews. After all, it is a review of reviews that performed data synthesis themselves. Furthermore, the umbrella review usually includes a strict measure of review quality, transparency, and reproducibility by using a pre-existing assessment framework.
Meta-analysis
- Used in the following of our PFAS projects: Cooking
A meta-analysis collects scientific studies on a specific topic and re-analyses the data of these studies in a large new dataset. It is unlikely that any research question you can think of wouldn’t have at least a few studies investigating it. It is very common that these studies, despite exploring the same question, resulted in different outcomes. These results can be put together to draw overall conclusions.
Meta-analysis originates from medical research where it has always been essential to determine the ‘true’ effect of a given medical treatment. However, let’s take the meta-analysis showcased on this website as an example. Our project Cooking investigated if cooking is capable of reducing the PFAS burden in food items. We found 10 studies that explored this question. Some of these studies found a reduction in PFAS, others detected an increase, and some didn’t observe any change at all. It is now the job of the meta-analysis to determine the overall effect size, that means the overall outcome of all the included studies. Does cooking reduce PFAS burdens or not?
Eventually, the result of a meta-analysis has much more weight and would be expected to come much closer to the scientific ‘truth’ than any individual study ever could, as the sample size in the meta-analysis is much larger than any of the individual studies. Naturally, by combining a large number of different studies, there is a lot of variation in the study design. In our example, this would have been different types of fish and seafood used, different cooking methods applied and so on. These differences have to be carefully considered and accounted for in the statistical approach of the meta-analysis. In addition to determining the overall effect, the meta-analysis can also help to determine which factors (called moderators) in the study design have the most impact on the outcome. In our example, we tested the following moderators: cooking technique, temperature, time, volume of cooking media, etc.
Like in the evidence map, it is essential to follow the process of a predetermined framework in performing the meta-analysis. This includes the selection of scientific databases and search strings for the literature search, the creation of a decision tree including eligibility criteria and the choice of data that is extracted for the meta-analysis. These predetermined rules are supposed to ensure the meta-analysis’ quality, reproducibility, and transparency.
Bibliometric analysis
- Used in the following of our PFAS projects: Burdens in wildlife and Umbrella review
Bibliometric analysis is a possible add-on to a systematic evidence map, a systematic review map or even a meta-analysis. Bibliometric analysis uses information about multiple scientific publications, and their authors, and summarizes it with or without a statistical analysis.
Let’s try to break this rather abstract concept down in a more easily understandable way. As always in science, we start with a research question. In our project Burdens in wildlife, we used the bibliometric analysis to shed light on the following questions: ‘Which countries are most active in this field of research?’; ‘What’s the publication trend in the past decade?’; ‘Which publications are the most influential in the field?’; ‘What is the level of collaboration between the authors of the publications?’; ‘What are the academic disciplines involved in this field?’
These questions are just examples of what bibliometric analysis is capable of exploring. To answer these questions, we collected the following data on each paper:
- ‘Which countries are most active in this field of research?’ → Country of first authors
- ‘What’s the publication trend in the past decade?’ → Publication year
- ‘Which publications are the most influential in the field?’ → Number of citations
- ‘What is the level of collaboration between the authors of the publications?’ → Co-authorships
- ‘What are the academic disciplines involved in this field?’’ → Keywords
The result of the bibliometric analysis is generally presented in a visual way, including diagrams and colour-coded maps. The reader is supposed to gain an understanding of the outcome of the analysis at a glance. Bibliometric analysis can be strictly descriptive, but it can also include statistical analysis to quantify findings.
Summary
In summary, all the types of data synthesis presented here (systematic evidence map, systematic review map and meta-analysis) are a form of review. They all belong to the family of systematic reviews (except the narrative review). Whereas the systematic maps create a database on a certain topic to allow an overview of a research question and thus remain mostly descriptive, the meta-analysis adds a quantitative element by estimating the magnitude of an overall effect. However, systematic maps can, as we have done in our PFAS projects, also contain a quantitative element, the bibliometric analysis.